Logistic Regression
· Logistic regression is widely used for binary
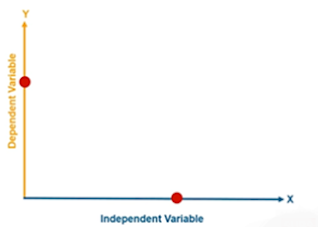
classification problems. It gives binary output. A binary dependent variable
can have only two values, like 0 or 1, win or lose, pass or fail, healthy or
sick, etc.
·
Logistic Regression: Output is in Binary
·
It can also be extended to multi-class classification
problems whose output can be classified into more than one category.
·
Logistic regression can be used to predict a
dependent variable(output) on the basis of continuous and/or categorical independents(input)
·
The dependent variable(output) is
categorical: y ϵ
{0, 1}
·
It is scalable and can be very
fast to train. It is used for
– Spam filtering
– Web site classification
– Product classification
– Weather prediction etc.
·
The only caveat is that it can overfit very
sparse data, so it is often used with Regularization.
There are two types of logistic regression
• Binary
logistic regression-It is used when the dependent variable(output) has only
two values, such as 0 and 1 or Yes and No.
e.g.
Students can pass or fail based on the number of hours the student has
studied.
e.g
Mail in the mailbox is spam or non-spam
• Multinomial
logistic regression It is used when the dependent variable(output) has
three or more classes e.g. weather prediction is classified into four classes cloudy, rainy, hot, or cold.
Why
and when should we use Logistic Regression?
Logistic
regression does not assume a linear relationship between the dependents and the
independents
If we try to plot a Linear regression line then it will not classify the data properly. Instead of linear regression, it requires a logistic regression curve. Linear regression curve can not be used to classify binary data, because it does not have a normal Distribution.
If we plot the logistic curve then it will classify data properly as shown below
Mathematical
model
Steps
to find a Logistic Regression curve:
1.Find
the probability of events happening
2.
Find the ODDS- Odds is the probability of something occurring divided by the
probability of not occurring and is given as
odds=P(Occuring)/P(not Occuring)
Odds=P/1-P
As the probability increases (from zero to 1), the odds increase from 0 to infinity
The log of the odds then increases from –infinity to +infinit
3. Find the odds ratio of two odds of two events and is given as
Odd(heads)=odds1/odds
04. Find the log (odds)
5. Find the Sigmoid of this function
In this equation, t represents data values * number of hours studied and S(t) represents the probability of passing the exam.
The
points lying on the sigmoid function fits are either classified as positive or
negative class. A threshold is decided for classifying the cases.
The
Estimated Regression equation :
The
antilog of the logit function allows us to find the estimated regression
equation.
We know that
This is the estimated regression equation.
n
We use maximum
likelihood to estimate what the B0 and B1 are.
n
Maximum likelihood is an iterative process that estimates the best-fitted equation.
n
The iterative bit just means
that we try lots of models until we get to a situation where tweaking the
equation further doesn’t improve the fit.
n
The maximum likelihood bit
is complicated, although the underlying assumptions are simple to
understand and very intuitive. The basic idea is that we find the coefficient
value that makes the observed data most likely
Difference between logistic and Linear
regression
|
Linear · To predict a continuous
dependent variable based on the value of the independent variable · Dependent variable is always continuous · Least square method is used · Output is a linear curve · Y=bo+ b1*x+e · Business prediction, Cost prediction |
Logistic · To predict categorically
dependent variables based on continuous or Categorical independent variable · Dependent variable is categorical · Maximum likelihood probability is used · Output is the Sigmoid curve · Predicted binary value · Classification Problem e.g Image prediction |
Probability and Odds
· "Probability"
and "odds" are both terms used in the context of chance and
uncertainty, but they represent slightly different concepts. Here's an
explanation of each term:
· Probability:
Probability is a measure of the likelihood that a specific event will occur.
It's expressed as a number between 0 and 1, where 0 represents the event is
impossible, 1 represents the event is certain, and values in between indicate
varying degrees of likelihood. The formula for probability is:
· Probability
= (Number of Favorable Outcomes) / (Total Number of Possible Outcomes)
· For
example, if you're rolling a fair six-sided die, the probability of rolling a 3
is 1/6, because there is one favorable outcome (rolling a 3) out of six
possible outcomes (rolling a 1, 2, 3, 4, 5, or 6).
· Odds:
Odds represent the ratio of the likelihood of an event occurring to the
likelihood of it not occurring. Odds are typically expressed as a ratio or a
fraction. The odds in favor of an event A happening are calculated as:
· Odds
in Favor of A = (Number of Favorable Outcomes) / (Number of Unfavorable
Outcomes)
· The
odds against event A happening are the reciprocal of the odds in favor of event
A.
· For
example, if you're rolling the same fair six-sided die, the odds in favor of
rolling a 3 are 1/5, because there's one favorable outcome (rolling a 3) out of
five unfavorable outcomes (rolling a 1, 2, 4, 5, or 6).
· To summarize:
· Probability
is a measure of the likelihood of an event occurring and is expressed as a
number between 0 and 1.
· Odds
represent the ratio of the likelihood of an event happening to the likelihood
of it not happening and are typically expressed as a fraction or ratio.
Both concepts are used in different contexts and have their own mathematical interpretations, but they are closely related and often used interchangeably in everyday language.


Comments
Post a Comment